Diversity Map Shows Migration Of Americans — Away From Diversity
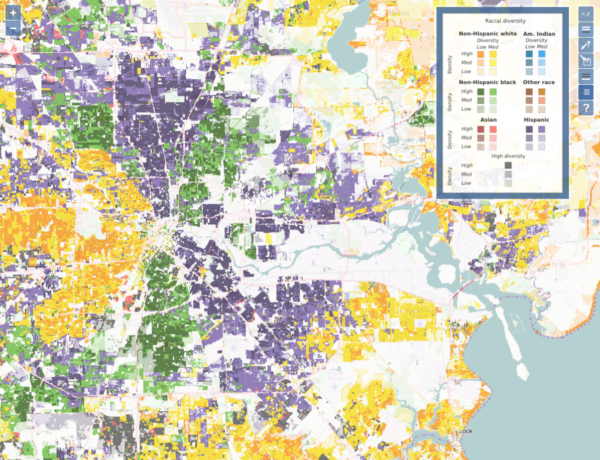
The recently released diversity map from the University of California shows which areas in America are most diverse. Every area of the United States is color-coded with dots representing the frequency of different populations.
What is interesting is that this map shows the racial distribution of different areas from 1990 onward. In doing so, it unwittingly reveals a pattern: Americans are moving away from the more diverse areas and toward less diverse ones, both on the local and state level. This shows a preference for relatively uniform racial groupings no matter what race is in question.
For example, looking at Texas, we see relatively ethnically fragmented neighborhoods in 1990 having gone to mostly one color or another. Scanning California cities shows us that the places which are losing population tend to be gaining diversity, and as one group disappears, a mixed group appears and then is replaced by a more uniform group.
As has been said around here frequently but perhaps not enough, diversity cannot work: each group has its own genetic inclinations which manifest in different values and standards. Those are not stable and safe until the group achieves at least majority status in some area or another.
In order to make that happen, Americans are leaving diversity behind, ironically to preserve diversity by keeping their heritage groups intact.
Tags: diversity, diversity map, resegregation


![]()


- Popular
- Crowdism
- Ethnomasochism
- The Increasing Mediocrity Of Everything
- The Alt Right Is Tired Of Living In Mordor
- Nihilism Is The Basis Of Conservatism
- The Nationalism FAQ
- Beyond the Absolute
- Conservationism Versus Environmentalism
- The Self-Inventing Totalitarian State
- The Biological Basis Of Race
- Whites Going Their Own Way
- How Individualism Defeats Conservatism