Garrett Hardin On Wealth And Poverty

A culture of poverty is one in which the future is discounted — both implicitly and explicitly — at a very high rate. “ Garrett Hardin
Garrett Hardin inspired me to discuss what differentiates rich people from poor ones. Do not get hung up on money in and of itself. There are other scales that measure one person’s wealth versus another one’s poverty. The hypothetical money I’ll be discussing, assuming it obeys the laws of an effective currency, will merely serve its noble purpose as a store of value. Or as one Big Shwingin’ Dick put it: “Money was never a big motivation for me, except as a way to keep score. The real excitement is playing the game!â€
We on the Alt-Right talk in terms of time preferences when we discuss the discounting of the future. If the present moment has a very high opportunity cost, you have a high time preference. That’s a nice way of saying that you are too impatient to worry about the future. YOLO is true, but it cuts both ways. You try to experience things, but you have to watch the risk and the cost. Once it’s done, it’s done.
So what’s it like when the future gets discounted? If you’ve worked in cost analysis or banking an easy analogy involves the impact of inflation on the value of money. The basic equation looks a tad like this. Where Pn is the present value of the wrinkled and faded $1 bill I found in my yard jeans the other day,
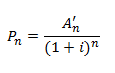
A’n is the original value of the dollar. I is the rate of inflation and n is the number of time periods.  So a 10% rate of inflation would make a $1 have a real value (Pn) of about 91 cents. If n represents your time preference, next year is only 91% as valuable as last year. We can draw a chart of how much future time is devalued with a 10% time preference.
Another way we can slice and dice this data is to determine how much time is required to reduce the time preference to 50%. (AKA a half-life). Here A(t) is the value at time t. A(t) = Ae-0.095t This form of the Future Value equation can be solved for the time required to hit specified future values. Since the original value was $1.00, we can set up the equation $0.50 = e-0.095t. The half-life of a $1 under 10% inflation is 7.2 years.
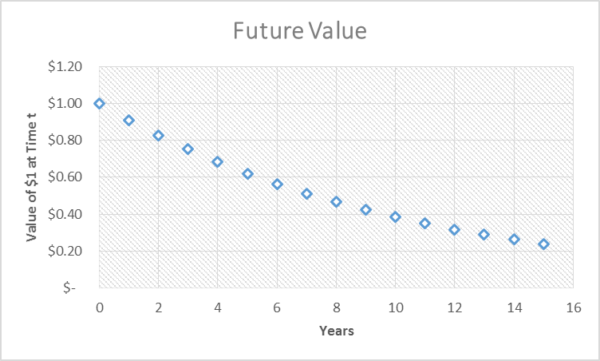
Now what happens if you can add value with time? Let’s say we get return on investment. If we can get a 15% return, the equation becomes P(n)= A(1+i). The graph predictably slopes the other way. In fact, the value of the dollar doubles in about 4.25 years.
Now most people will not be totally neutral towards having a cookie now or getting a cookie later. However, if you can grow the size of your cookie, you may be willing to wait and have a bigger one later. Your present hunger is balanced in tension against the anticipation of what you could get your mitts on later.
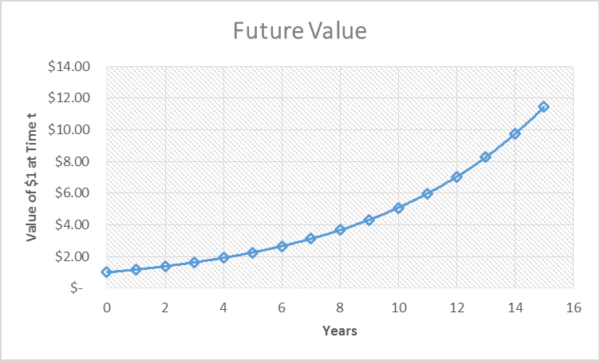
So let’s examine what that tension would look like mathematically. We compare the rate of return to the rate of inflation. That is, we compare the rate of return to our aversion to waiting before we enjoy some benefit. A 15% ROI minus a 10% rate of inflation gives us a real rate of return = 5%.
Now here is where getting people to plan ahead is tough. The fictional dollar doubles in 4.25 years. When we factor in the 10% time preference for present benefits over future, our actual happiness from the increased money takes 13.5 years to double.
To hammer home exactly what Hardin meant by his quote, let’s juxtapose the first curve of a totally present-oriented consumer versus the normal, conflicted guy who improves his lot over time, but doesn’t like postponing gratification forever.
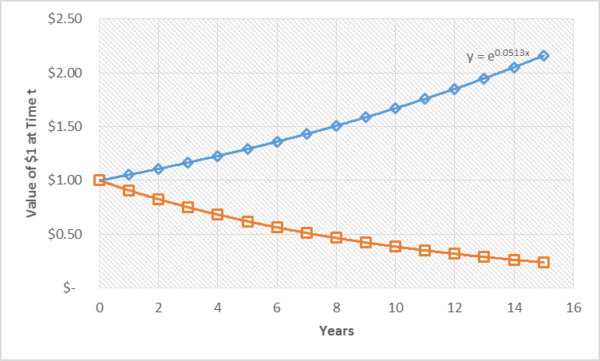
The blue line represents the person who invests in the future at cost to his present desires. The orange line is a person who only sees present benefit. Over time, the lines diverge. They increasingly diverse. The longer the two people have different views on time preference, the further their destinies diverge. The distance between the top and bottom line is the distance in life between rich and poor.
So all this theory is quaint, and I’ve gotten to play with Excel even. But how does any of this translate into real life? What happens to the poor? What is the cost of giving up benefits later to have it now? What you give up is your future.
Tags: Garrett-Hardin, inflation, poverty, time preference


![]()


- Popular
- Crowdism
- Ethnomasochism
- The Increasing Mediocrity Of Everything
- The Alt Right Is Tired Of Living In Mordor
- Nihilism Is The Basis Of Conservatism
- The Nationalism FAQ
- Beyond the Absolute
- Conservationism Versus Environmentalism
- The Self-Inventing Totalitarian State
- The Biological Basis Of Race
- Whites Going Their Own Way
- How Individualism Defeats Conservatism